Pi Zero DHT11
Tutorial for using a DHT11 from your Raspberry Pi Zero with RRDTool and AWS S3 for a cheep IOT Solution.
Pi Zero IOT Platform - Part 2 DHT11
This is a tutorial for how you can use a DHT11 Temperature and Humidity sensor along with RRDTool and AWS S3. This artcile continues the concepts from our Pi Zero IOT Platform tutorial but swaps out the BME280 I2C sensor for a cheeper DHT11.
*This tutorial assumes you've already setup your Pi for wifi.
Here is a live example of what our little Pi Zero is capable of. These graphs are generated by our bme280 sample but they are identical for our DHT11 except we won't have pressure readings.


Parts List
Step 1 - Software Setup
Install our pre-requisite software, namely RRDTool and SMBus.
sudo apt-get install python-smbus python-boto python-rrdtool rrdtool python-pip
and then install tendo for our singleton support
pip install tendo
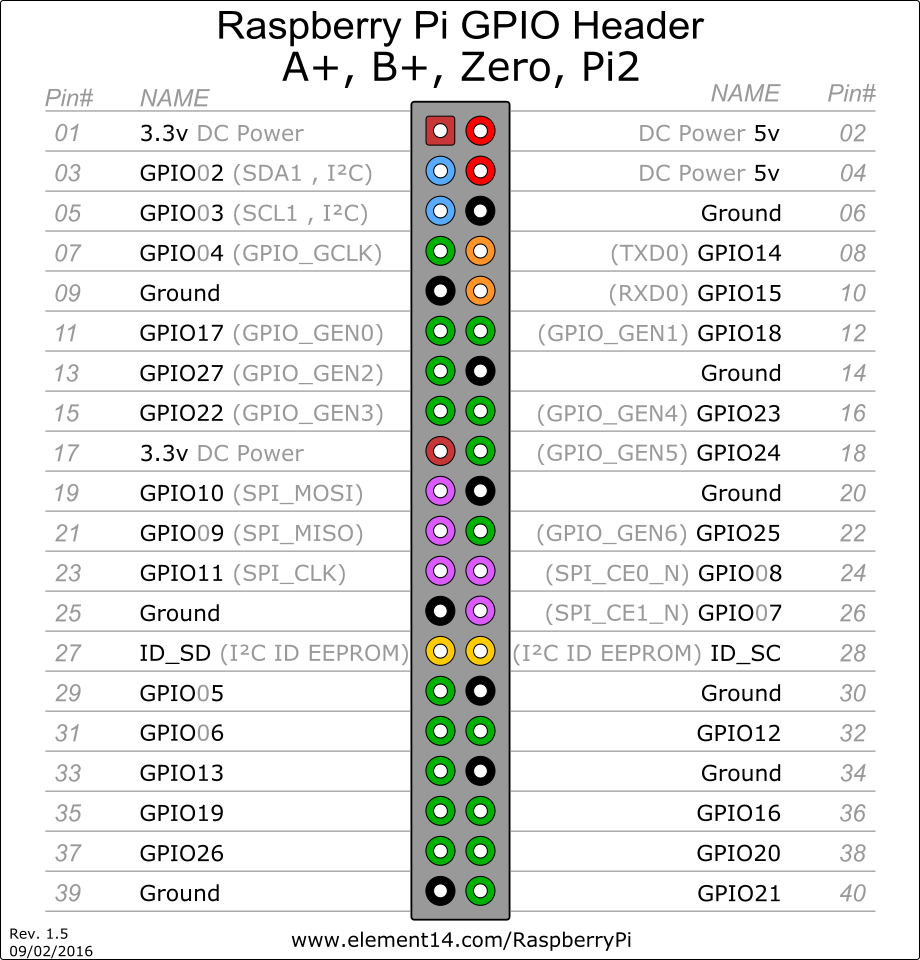
Step 2 - Wire Our DHT11 to VDD, GND, and GPIO.
Since we've walked through this in a previous tutorial, I won't repeat every step. Here is an image of how to wire up both the pi and the DHT11 via i2c.

Once you have it wired up, we can run i2c probe to see if our sensor is detected.
Step 3 - Setup Our IOT Python Script
Grab a copy of the tutorial's python scripts my GitHub - DHT11 Tutorial.
You'll want to take a close look at dht11_collectd.py as this script requires a few settings, namely. Your AWS Access Key, AWS Secret Key, and the location in S3 to post the graphs to.
These configs are easily configured via environment variable to collectd.py
export NODENAME="pi154bme280" export AWSACCESSKEY="XYZ" export AWSSECRETEKEY="XYZ" export AWSBUCKET="XYZ" export HTTPPORT="8000" /home/pi/projects/pizero/dht11/dht11_collectd.py
You can disable the embedded web server which makes the rrd graphs available over http by not setting the HTTP_PORT env variable. Similarly, ommitting the AWS environment variables will disable upload of the graphs to S3.
This script uses RRDTool to store up to 5 years of 1 minute, avg, min, and max data for our sensors. It also retains 48 hours of 1 second data since it samples our sensors once a second.
Step 4 - Finished
If we update the graph every 5 minutes we can expect this to cost us ~ $0.52 cents a year in S3 costs. It will be tough to find a cheeper hosting option :)
And best of all, we get to keep our data and control visualizations, unlike services like ThingSpeak, Nest, EcoBee, etc...